Logs
Phase Two provides built-in log access for dedicated clusters through the self-service dashboard: interactive streaming for troubleshooting, structured event and request logs, and retained log files for download.
Visit your cluster in the self-service dashboard and open the Logs section. Depending on your plan and feature access, you may see these views:
- Cluster Logs — live streaming of cluster log lines for troubleshooting
- Event Logs — Keycloak event entries (logins, admin actions, etc.)
- Request Logs — individual HTTP requests in a structured table
- Download Logs — browse and download retained log files
All views share a common filter bar, and all timestamps are shown and queried in UTC.
Cluster Logs
Use Cluster Logs when you need to investigate a recent issue, narrow activity to a specific realm, or inspect individual log entries without leaving the dashboard.
If you have not selected a time range yet, the streaming view starts with the last hour of logs.
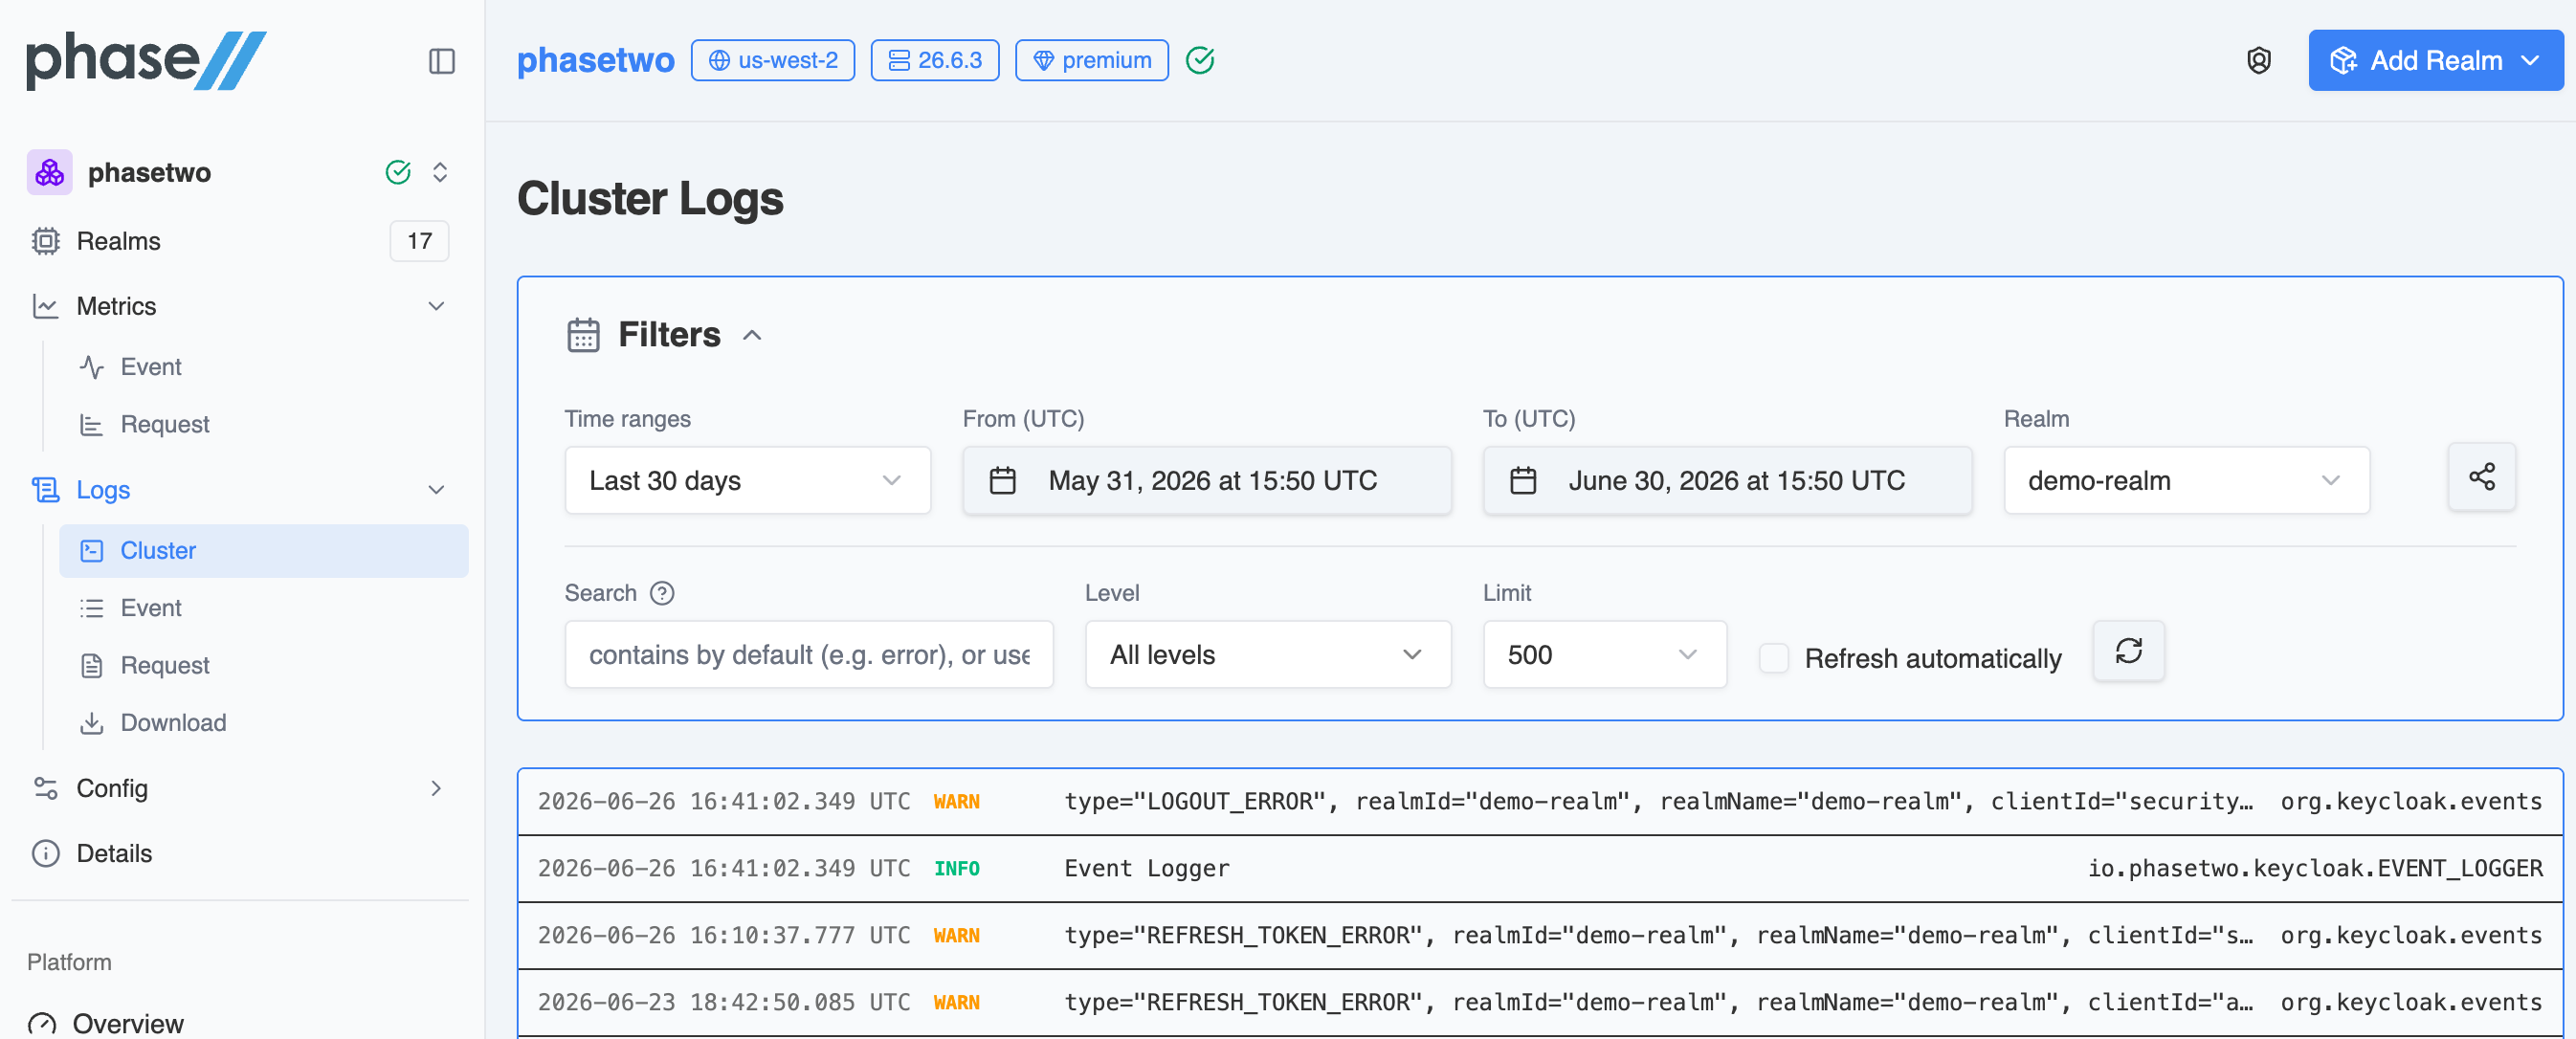
Filters and controls
The streaming view includes a filter bar for narrowing results quickly:
- Time range presets:
Last 15 minutes,Last 1 hour,Last 6 hours,Last 24 hours,Last 2 days,Last 7 days, andLast 30 days - Custom time window: set exact From and To values
- Search: text search with optional LogQL-style line match operators
- Realm: limit results to a specific deployment/realm in the cluster, or view all realms
- Level: filter by
INFO,WARN,ERROR,DEBUG,TRACE, andFATAL - Limit: choose how many rows to fetch per query:
200,500,1000, or2000 - Refresh: rerun the current query immediately
- Refresh Automatically: poll for newer log lines on a timer
If you need more history within the selected time window, use Load more at the bottom of the results list to fetch older entries.
Auto-refresh behavior
When Refresh Automatically is enabled, the viewer refreshes for new log lines every 30 seconds. To avoid runaway polling, automatic refresh stops after 5 minutes. It also turns itself off if the browser tab is hidden or unfocused for roughly 30 seconds.
Inspecting a log entry
Click any row in the results list to open the log details drawer. This lets you review and copy:
- the timestamp
- the detected level
- the logger name, when present
- the parsed message
- the full payload or raw log line
This is useful when a single line in the condensed list is not enough and you need the full structured payload or stack trace.
Search syntax and examples
The search field performs a simple contains search by default. For more precision, it also supports the common LogQL line-match operators below:
|=contains exact text!=excludes exact text|~matches a regular expression!~excludes a regular expression
Examples you can paste directly into the search field:
errorto find lines containing the worderror|= "LOGIN_ERROR"to find a specific event or message token!= "health"to exclude routine health-check noise|~ "timeout|connection reset|read timed out"to match several failure patterns at once!~ "GET /health|GET /metrics"to remove common probe traffic|= "LOGIN_ERROR" != "admin-cli"to find login failures while excluding a known source|= "NullPointerException"to surface Java exception lines|= "KC-SERVICES"to narrow results to Keycloak service messages
Use the dedicated Realm and Level filters when possible instead of encoding those constraints into the search box. The search field is best for matching message text and regex patterns in the raw log line.
Event Logs
Event Logs show Keycloak event entries — logins, registrations, admin actions, and similar — over the selected time range. Use these when you want to follow authentication activity as discrete, structured events rather than raw cluster log lines.
Event Logs are split into two tabs that share the common time-range and realm filters. A realm must be selected to view events.
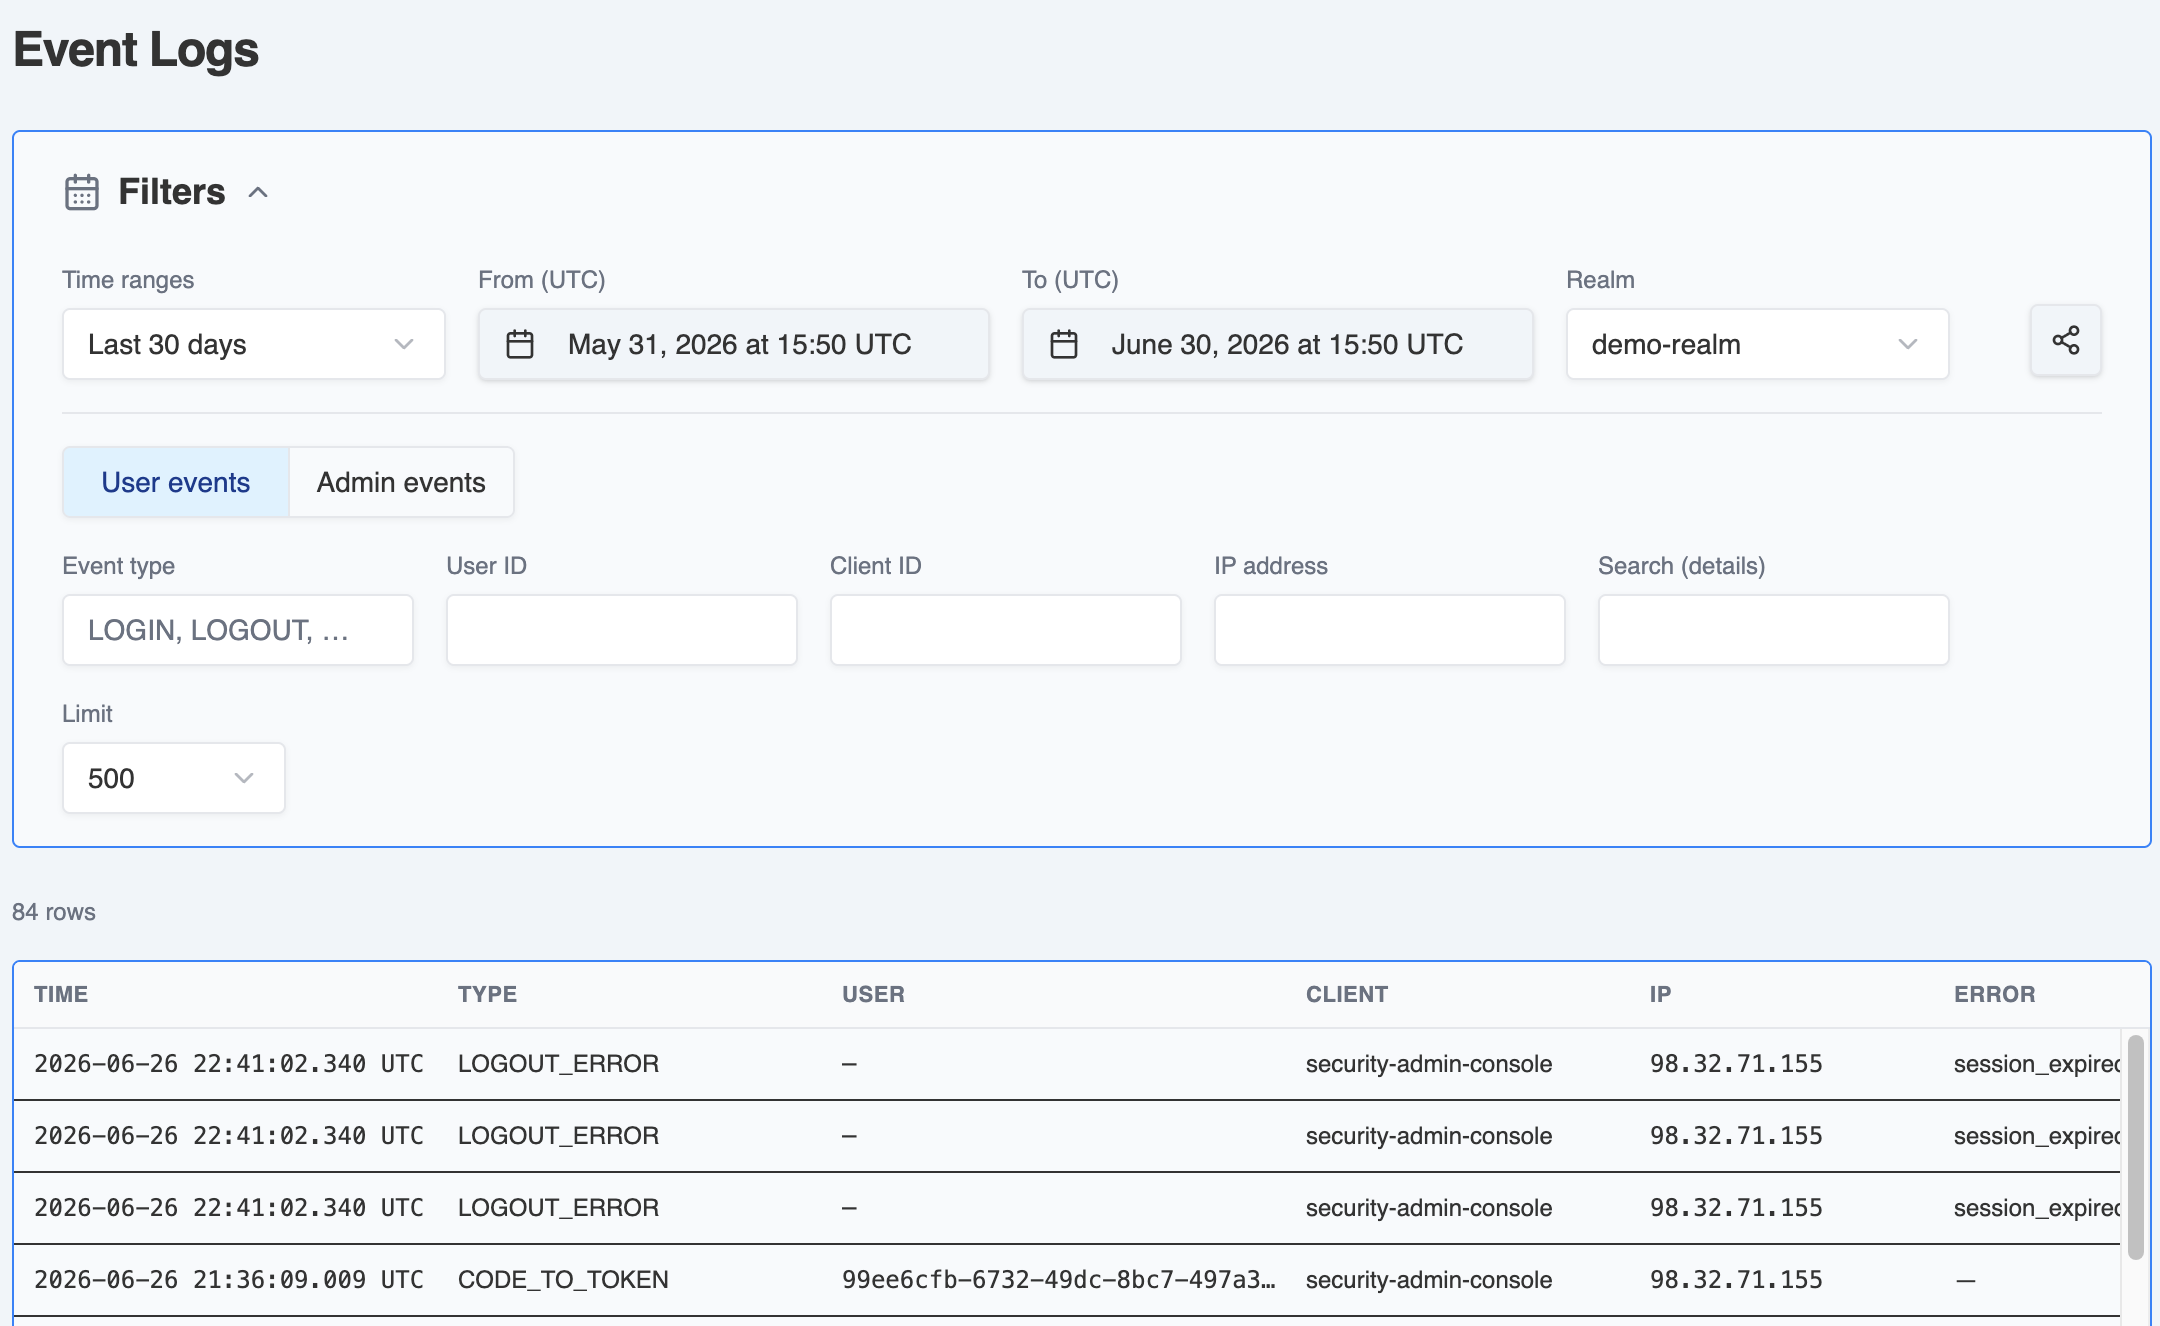
User events
User events cover authentication and account activity — logins, logouts, registrations, token exchanges, and similar. Alongside the shared filters, you can narrow by:
- Event type (for example
LOGIN,LOGOUT,CODE_TO_TOKEN) - User ID
- Client ID
- IP address
- Search (details) — free-text match against the event details
The results table shows Time, Type, User, Client, IP, and Error.
Admin events
Admin events cover administrative changes made through the admin console or API. The filters here are:
- Resource type (for example
USER,CLIENT) - Operation (for example
CREATE,UPDATE,DELETE) - Resource path (for example
users/…) - User ID and Client ID
- Search (repr/details) — free-text match against the representation or details
The results table shows Time, Resource, Operation, Path, Auth user, IP, and Error.
Limit and row count
Choose how many rows to fetch with Limit (100, 200, 500, 1000, 2000, or 5000; default 500). The count above the table shows how many rows matched, and notes when results are capped at the selected limit.
Inspecting an event
Click any row to open the detail drawer. It shows the full structured Event record, the Details payload, and — for admin events — the changed Representation. Each section is JSON-formatted and can be copied directly.
Request Logs
Request Logs present individual HTTP requests in a structured table over the selected time range. Unlike Event Logs, a realm is not required — by default you see requests across the whole cluster, and realm is an optional filter.
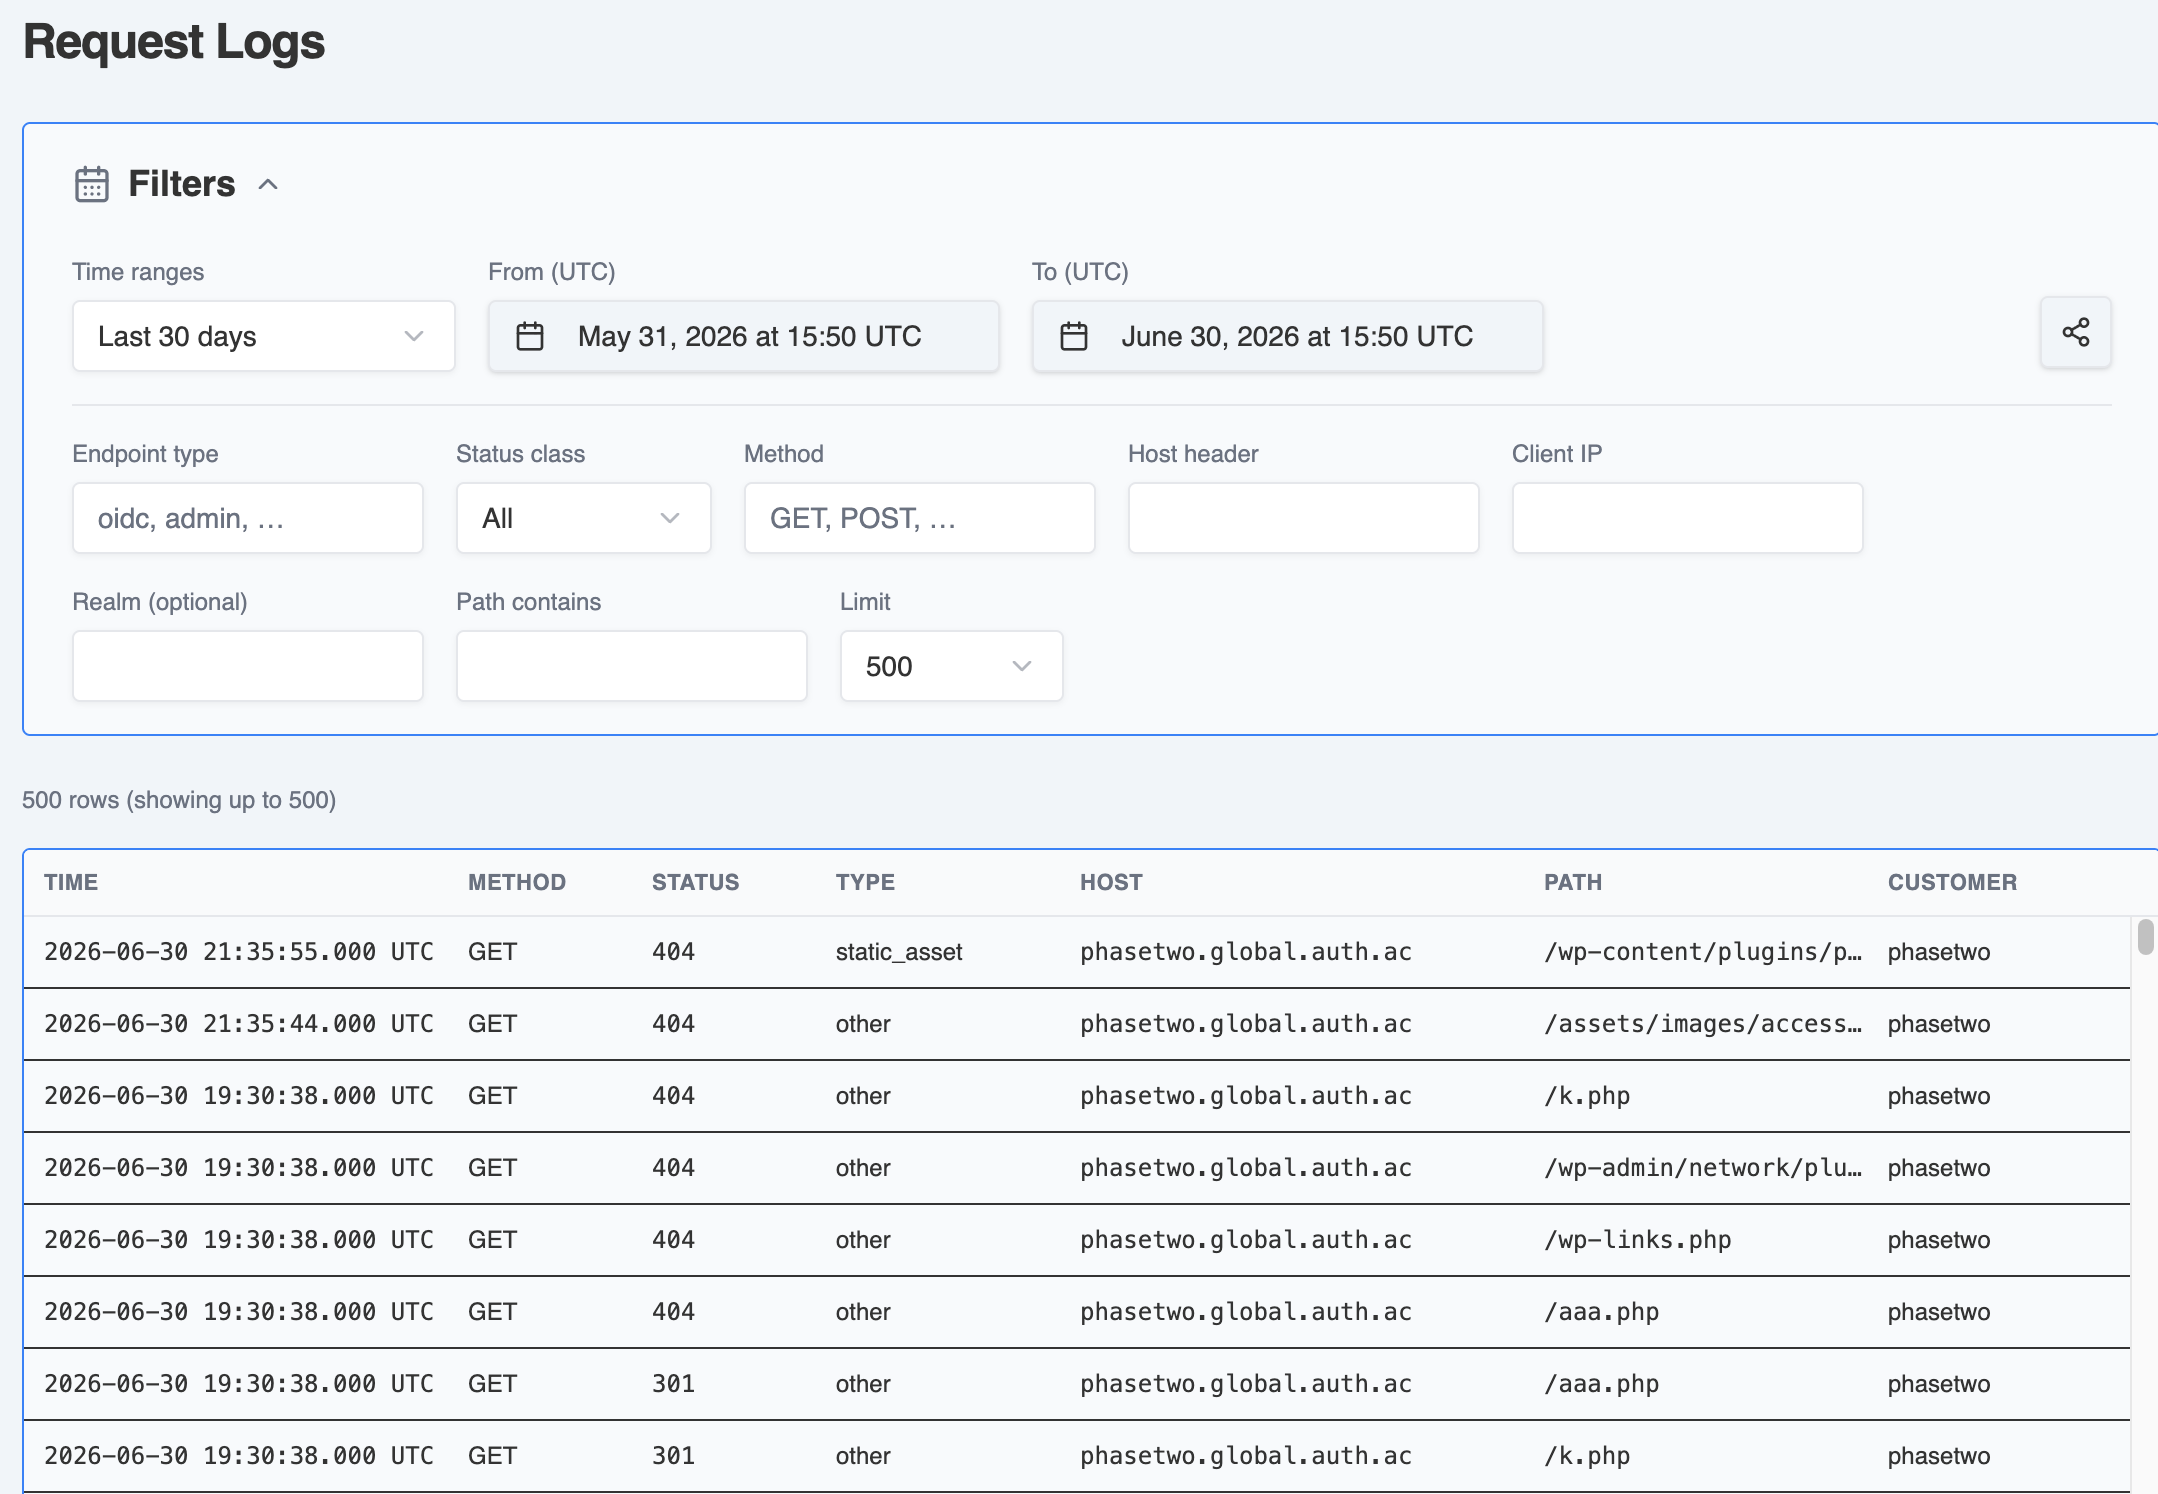
Filters
In addition to the shared time-range filter, you can narrow requests by:
- Endpoint type (for example
oidc,admin) - Status class —
All,2xx,3xx,4xx, or5xx - Method (for example
GET,POST) - Host header
- Client IP
- Realm (optional)
- Path contains — free-text match against the request path
- Limit —
100,200,500,1000,2000, or5000(default500)
Columns
- Time, Method, Status, Type (endpoint type)
- Host, Path
- Customer, Realm
- Cache (edge result), Latency (s), IP
Click a row to open a detail drawer with the full request record as JSON, which you can copy directly. Request Logs pair well with the Request Metrics charts: use the charts to spot an anomaly, then drop into Request Logs to find the specific requests behind it.
Download Logs
Use Download Logs when you need retained logs for offline review, auditing, or support cases.
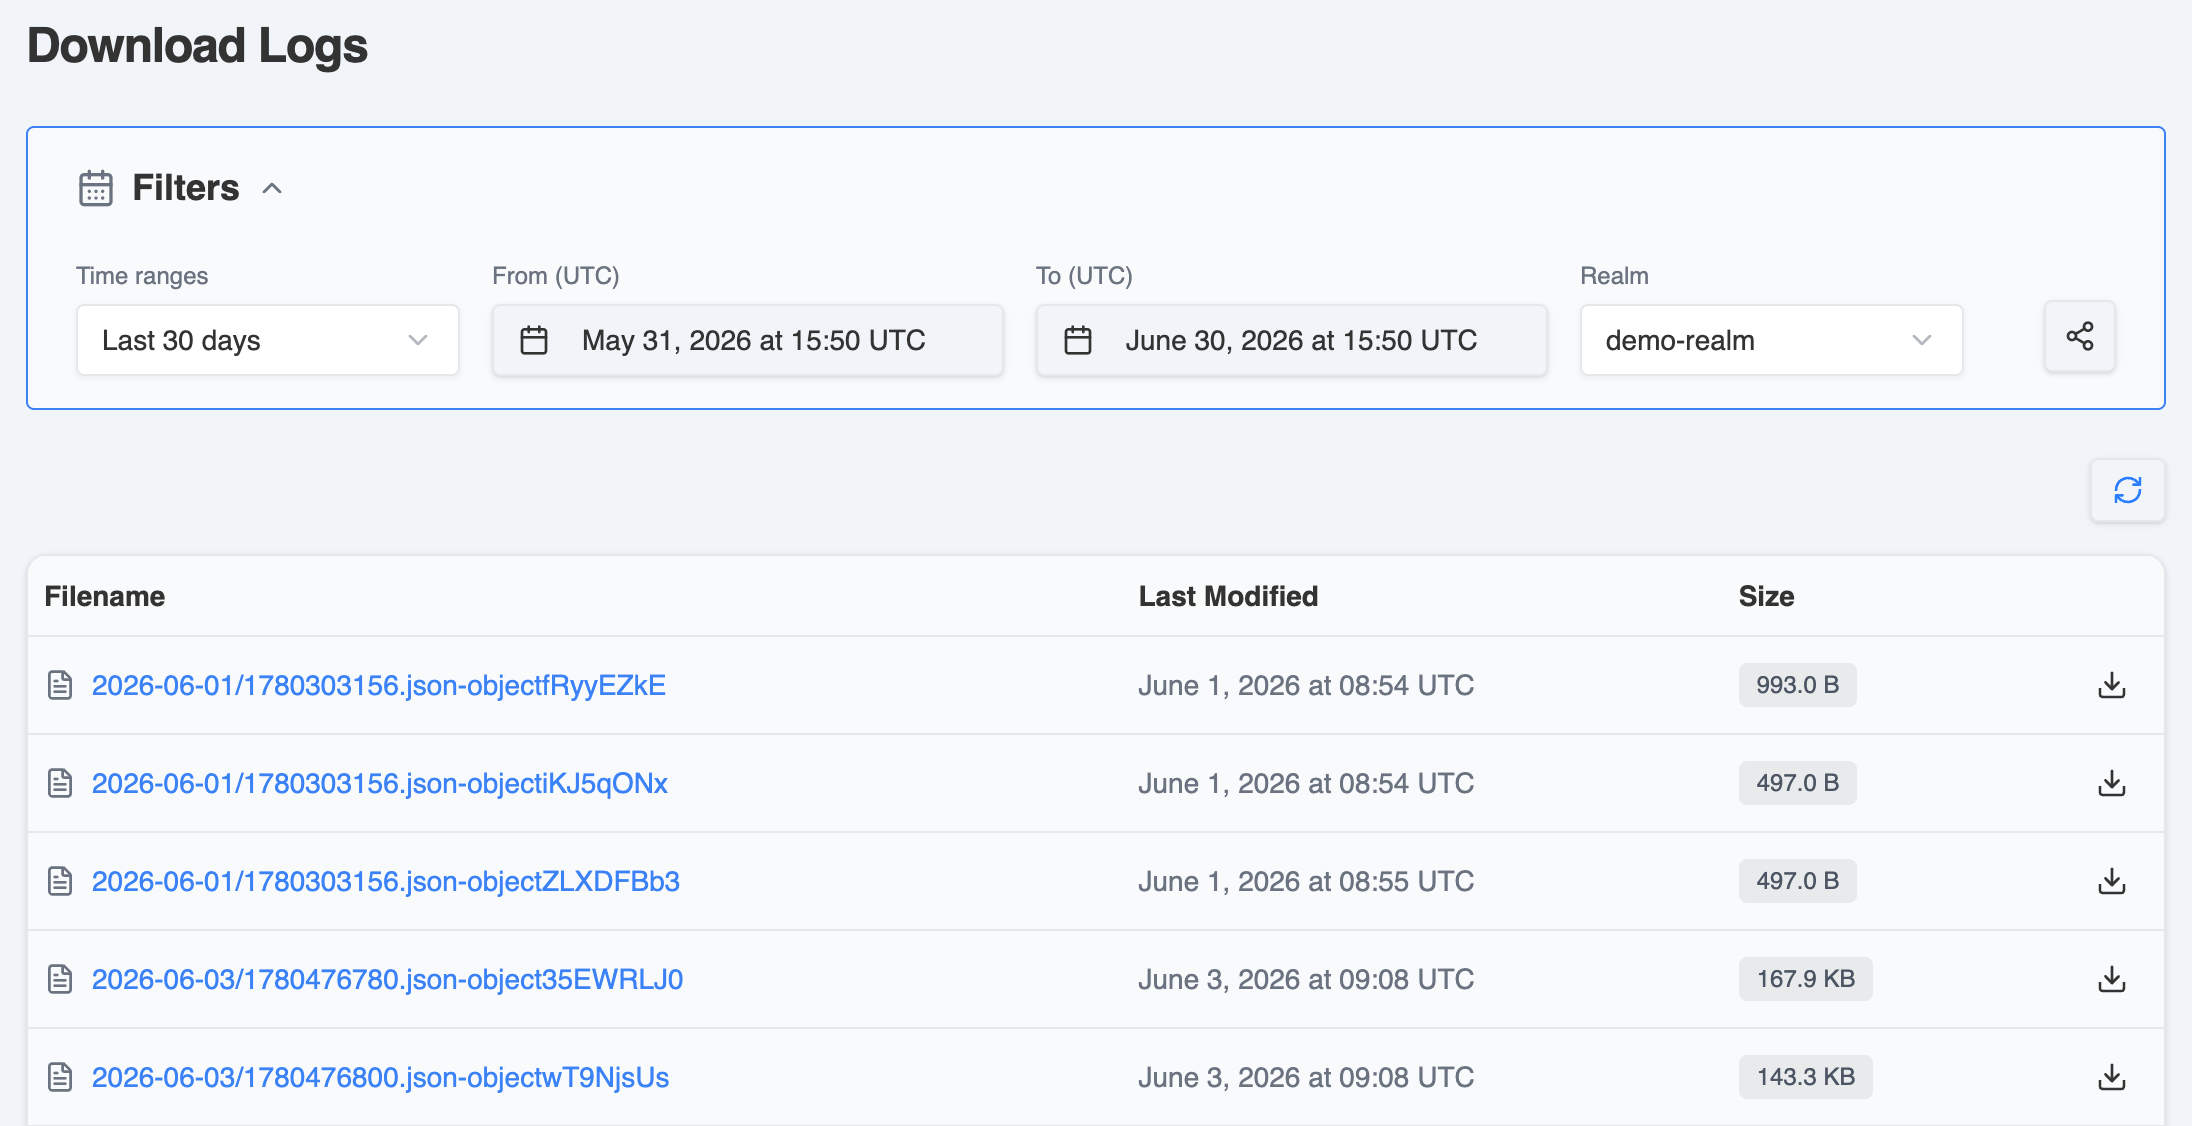
Working with log files
- If no time range is selected yet, the dashboard defaults to the last 7 days
- Quick ranges and custom From / To filters are available here as well
- All timestamps are shown in UTC
- The table lists the file name, last modified time, and file size
- Use the file name or the download action to download an individual log file
If no files appear, widen the time range first and then confirm that you are looking at the expected cluster and date window.
Access notes
If you see a message saying logs cannot be viewed due to lack of permissions, your account does not currently have access to that cluster's logs.